


Every channel one report, one set of metrics
Metrics that appear under different names in each platform’s dashboard will be brought together in one report with shared definitions, so you can truly compare channels.
We aim to show digital and traditional channel results in one report, using the same metric definitions.
Unified reporting is on the roadmap; integration status is visible in the dashboard today.
Share your goal and we’ll get back to you.
Each channel’s contribution is tracked on the same scale; rising channels stand out instantly.
A common languageRoadmap
Every channel measured by the same definitions.
Faster decisionsRoadmap
Weak channels are spotted early.
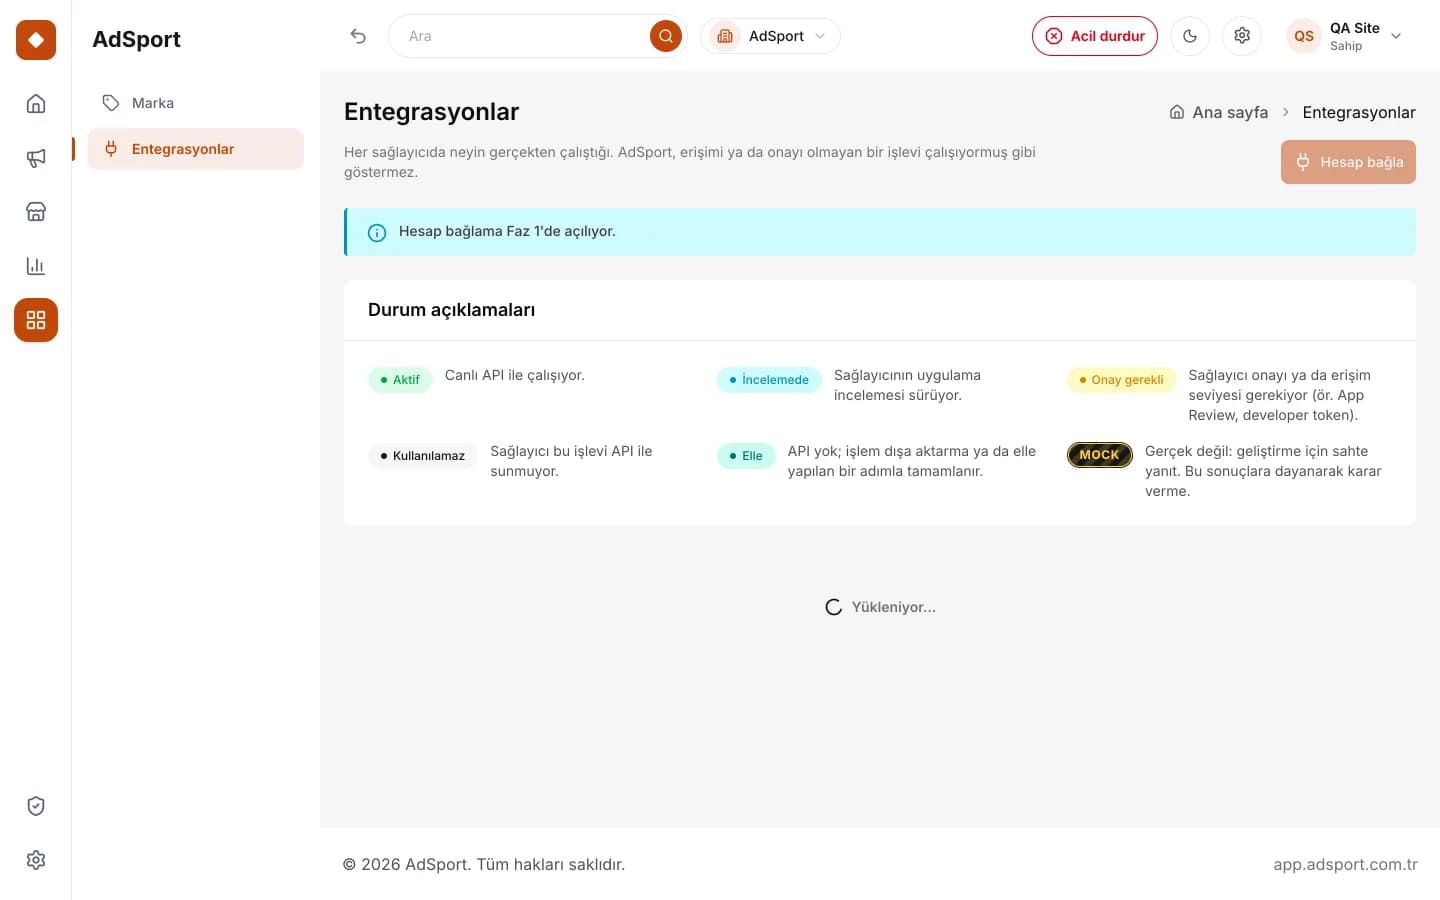 Real dashboard screen
Honest data
Unconnected sources are never filled with estimates.

Shareable reportsRoadmap
One view for your team and leadership.

ConnectRoadmap
Ad accounts are connected.

MapRoadmap
Metrics are mapped to shared definitions.

ViewRoadmap
Compare channels and periods.

ShareRoadmap
Reports are shared within the team.
Not yet. Google Analytics 4 and Search Console connections are on the roadmap. When the connection opens, its status on the Integrations page will be updated; today that page clearly shows that these connections are not yet available.
Each platform counts conversions with its own attribution window and rules. Because the unified report will apply the same definition to all channels, totals may differ from those in platform dashboards. The report will also show source information so you can see where the difference comes from.
Because traditional channels do not generate clicks, direct conversion measurement is limited. Indirect indicators such as proof of airing, estimated reach and a campaign-specific number or code are used, and they are marked separately in the report as estimated values.
No. Organization data is isolated at the database level with row-level security, and this isolation is live today. Each organization can access only its own data, and within the team, roles determine who sees what.

The form takes one minute.
Metrics that appear under different names in each platform’s dashboard will be brought together in one report with shared definitions, so you can truly compare channels.
Every ad platform counts results by its own rules. An action counted as a conversion on one platform is calculated over a different time window on another, and reach and impressions are estimated with different methods. That is why putting figures from separate dashboards side by side is often misleading.
AdSport’s unified analytics aims to define metrics with a single dictionary: spend, impressions, reach, clicks, leads and conversions, along with the derived CPA, ROAS, CTR, CPC and CPM, carry the same meaning in every channel.
The goal is to answer one question: what did each part of the ad budget deliver? That answer should also show where the data comes from and what limits it carries.
When search, social, influencer and publisher network results are calculated with the same definitions, you can genuinely compare which channel uses the budget more efficiently. Decisions no longer rest on different dashboards counting in different ways.
Total spend, channel shares and deviation from the plan are tracked on one screen. Without waiting for month-end, you can see which channel is behind or ahead of the plan and step in when needed.
The report states where each metric comes from and whether it was measured directly or estimated. That way you interpret the figures knowing how reliable they are.
You can share the same report with management, your team or your agency. Because everyone uses the same definitions, meetings can focus on decisions instead of debating what the figures mean.
For businesses that advertise in several channels, struggle to pull results together from different dashboards and want to base budget decisions on comparable data.
Brands with lead or sales targets that make budget decisions using ratios such as CPA and ROAS can assess channels against a shared standard.
Teams that regularly prepare reports for management or partners can reduce the work of compiling data from different sources.
It provides common ground for businesses that want to verify agency reports against their own definitions and look at the same data together.
Brands that use radio or outdoor alongside digital channels can see clearly how traditional channels appear in the report and within which limits.
Connections to ad accounts, Google Analytics 4 and Search Console are on the roadmap. Once they open, each connection’s status will appear on the Integrations page; today you can already see there which connections are not available yet.
Which action counts as a lead and which counts as a conversion is set at the brief stage. Data from all channels is matched and calculated against these definitions.
Channel data is gathered into one structure, and duplicate records and time zone differences are corrected. Values that cannot be measured or are estimated are flagged separately.
Results are presented in one report. The Performance Analyst role points out deviations from the plan and improvement options with its reasoning; the decision to act on them is yours.
In digital channels, impressions, clicks and conversions can be measured directly; even so, cookie restrictions, device switching and platforms’ different attribution windows mean every measurement carries some uncertainty. The report does not hide this uncertainty; it states where it comes from.
Traditional channels such as radio, print and outdoor produce no clicks. For these channels, indirect indicators are used, such as proof of airing, estimated reach, a campaign-specific phone number or code, or search interest during the campaign period, and they are marked as estimates in the report.
Metrics we track: Spend · Impressions · Reach · Clicks · Leads · Conversions · CPA · ROAS
The unified report and data connections are on the roadmap. The Integrations page, which clearly shows the real status of every connection, is live on the platform today.
Integration status
The status of each provider and capability, for example “approval required” or “not available yet”, is shown clearly on the Integrations page.
Ad account connections
Google Ads, Meta, TikTok, Microsoft Advertising and Yandex account connections, with read and publishing permissions, will open in stages.
Google Analytics 4 and Search Console
These connections, which will bring website and organic search data into the report, are on the roadmap and cannot be connected yet.
Unified report
An analytics layer that shows all channels in one report with shared metric definitions is being planned; this page will say so once it opens.
Live: available today at app.adsport.com.tr. Roadmap: in development, not yet available.
Tell us which channels you measure and how; in a demo, we’ll explain the shared-metric approach using your data.